Business Cycle
Mark Twain is quoted as saying, "History doesn't repeat itself, but it often rhymes." This can be applied to the business cycle as well. While each cycle is driven by different emerging technologies, themes, and narratives, there is generally an underlying fundamental driver that remains consistent. Hence, cycle.
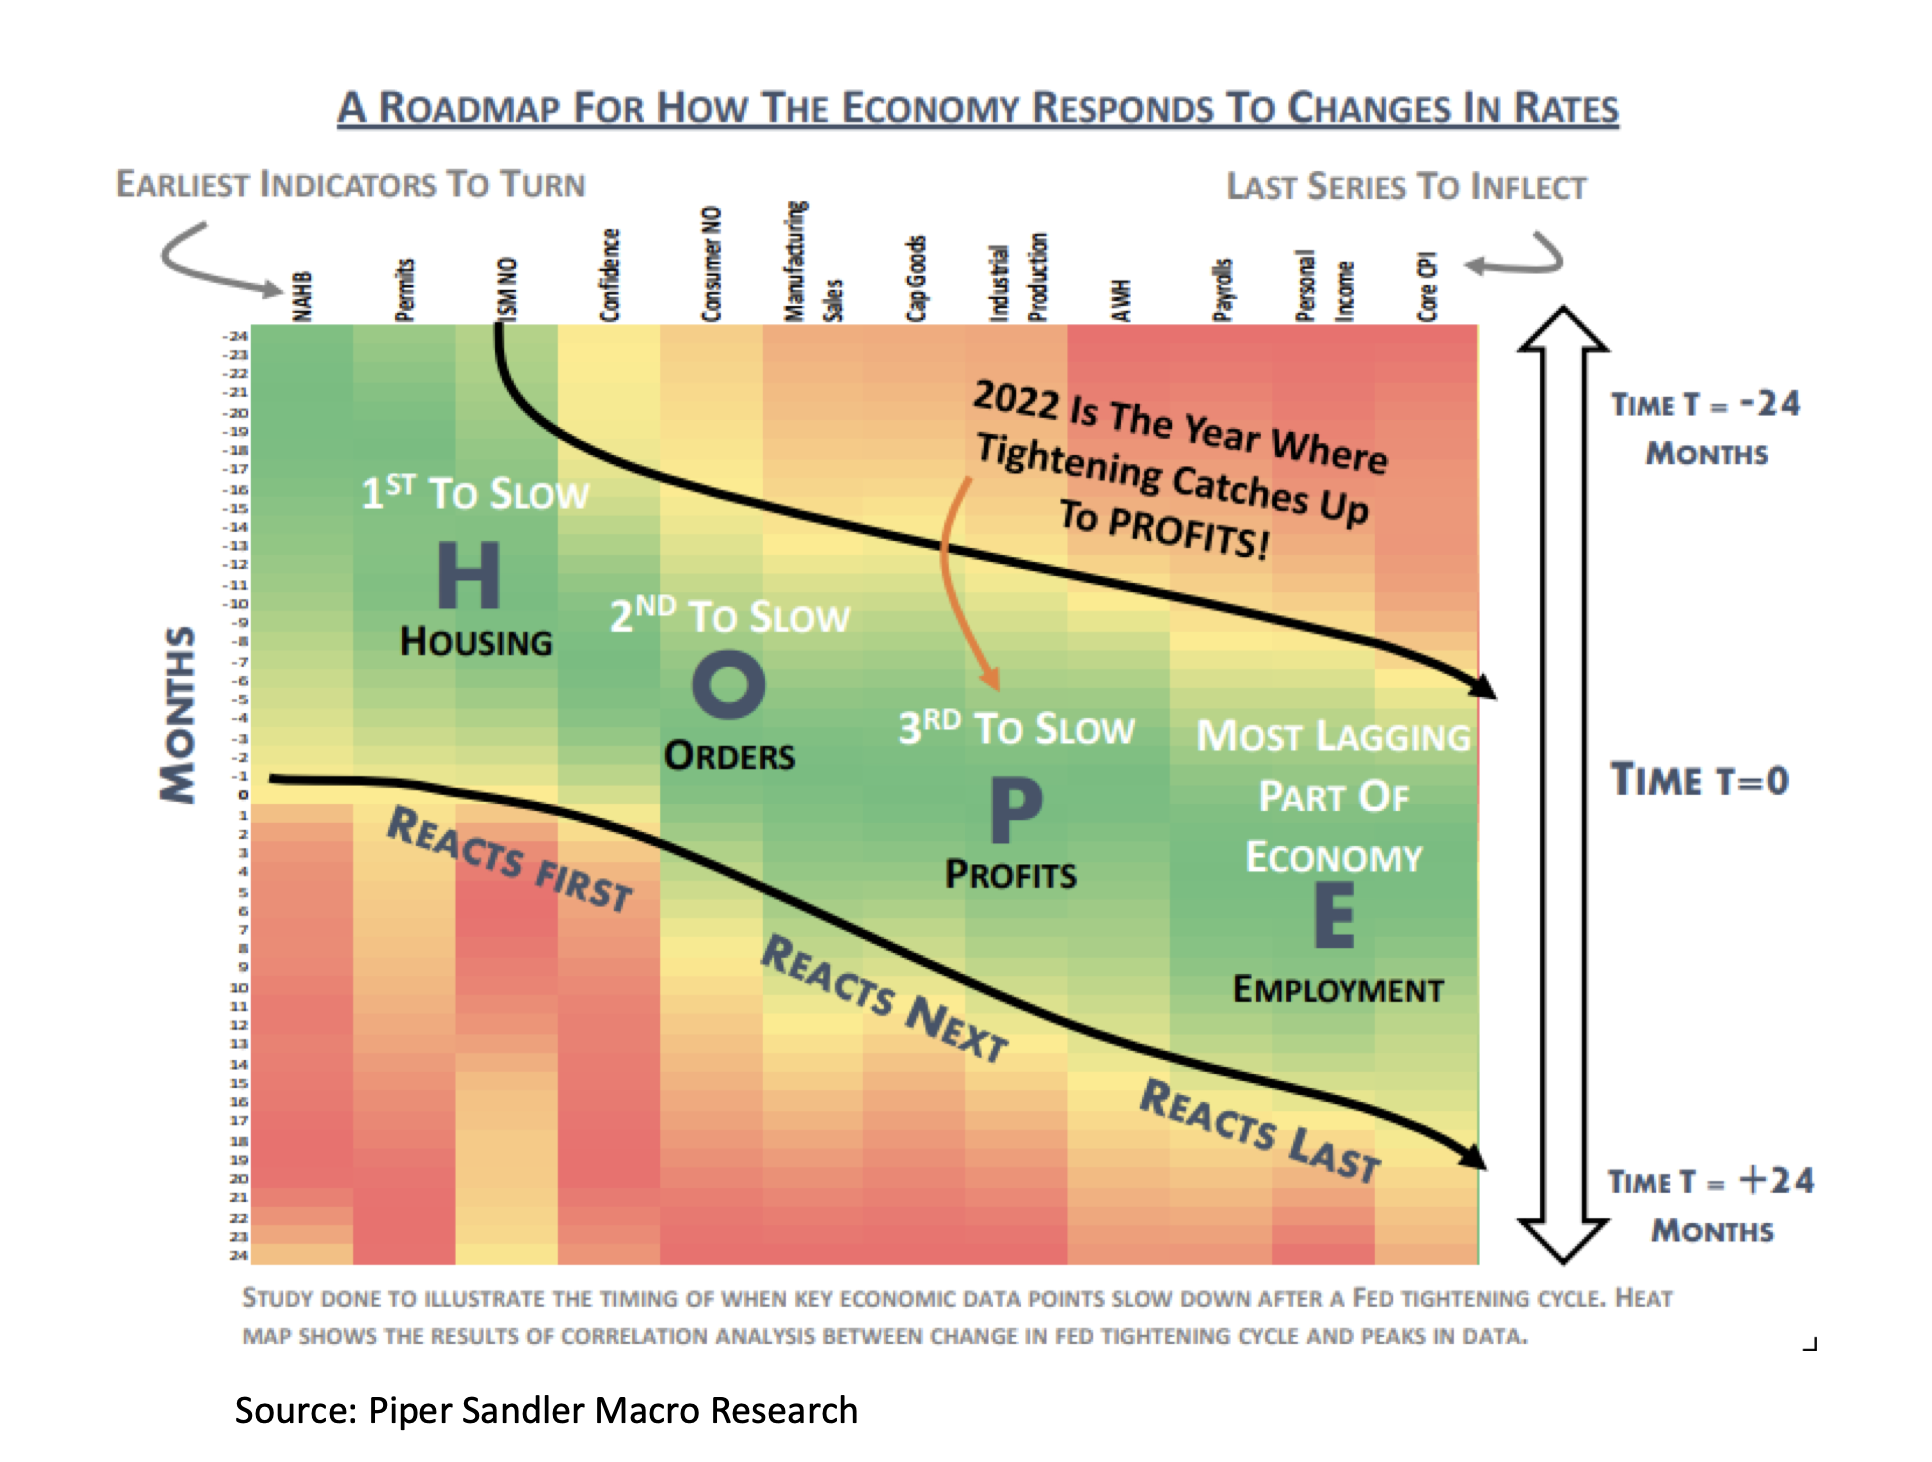
We find that cycles are driven by changes in the cost of money (the increase or decrease of interest rates). The chart below comes from Piper Sandler's Macro Research team and is an excellent visualization of how higher rates work their way through the economy. Using this framework, we can start to understand where we are in the business cycle and what may lay ahead.
Housing. The first part of the economy to get hit, as higher mortgage rates make homes less affordable. Rates tend to lead houses by roughly two quarters.
Orders. A slowdown in housing tends to lead to a slowdown in PMI data. Housing tends to lead PMI trends by roughly four quarters.
Profits. A slowdown in housing and PMI data often leads to a slowdown in corporate profits. Once PMI data softens, profits tend to follow by roughly two quarters.
Employment. Employment is the last part of the economy to respond to higher rates. Once profits start to deteriorate, employment tends to follow by roughly two quarters.